
A modular tool to aggregate results from bioinformatics analyses across many samples into a single report.
This report has been generated by the nf-core/checkatlas analysis pipeline. For information about how to interpret these results, please see the documentation.
Report
generated on 2023-07-22, 01:20
based on data in:
/data/analysis/data_becavin/checkatlas_test/tuto/work/2a/2331793a40995f995033511fd51186
General Statistics
Showing 1/1 rows and 5/8 columns.| Sample Name | Estimated Cells | Reads In Cells | Avg Reads/Cell | M Reads | Valid BC |
|---|---|---|---|---|---|
| SC3pv3_GEX_Human_PBMC | 5140 | 93.6% | 35473 | 182.3 | 98.2% |
Checkatlas Qc Report
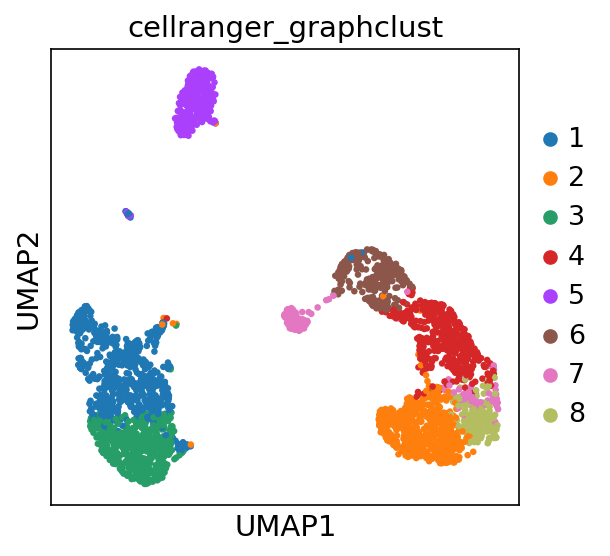
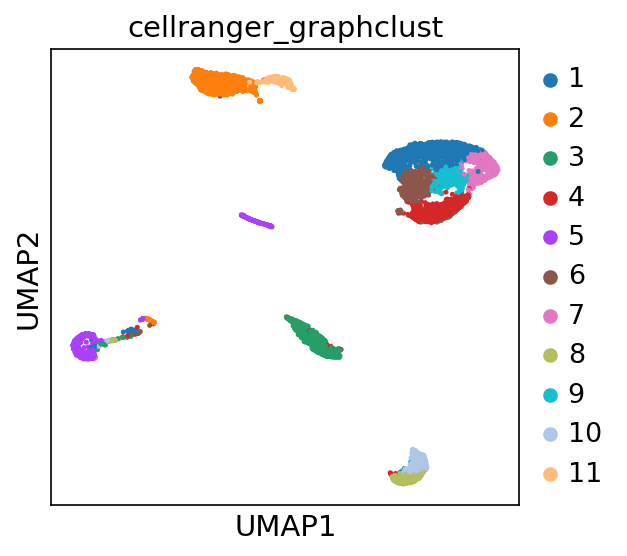
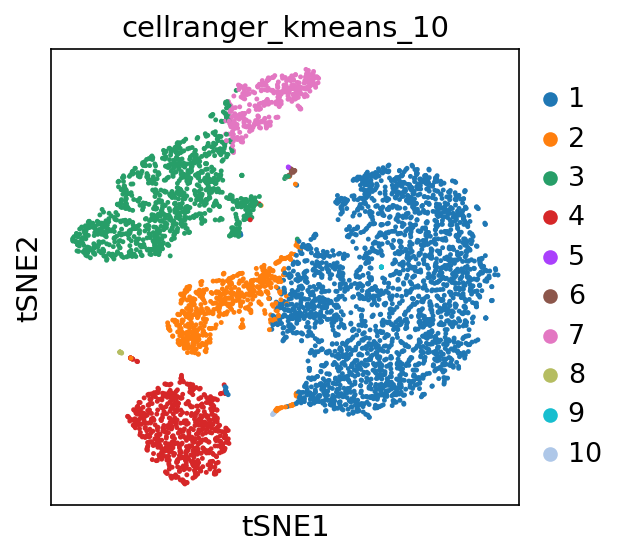
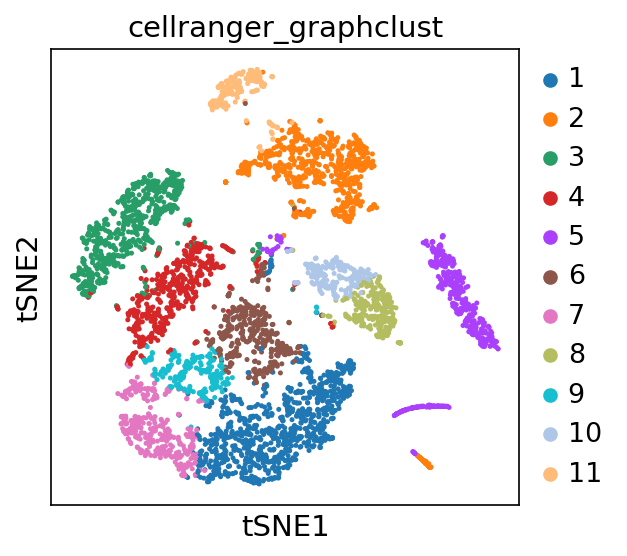
Checkatlas Umap Report
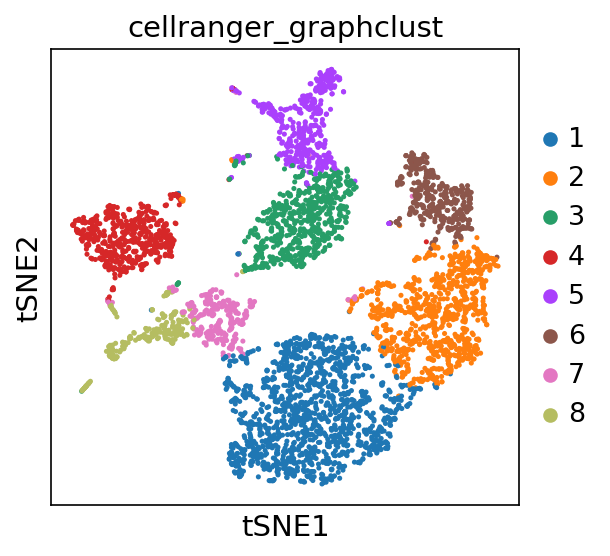
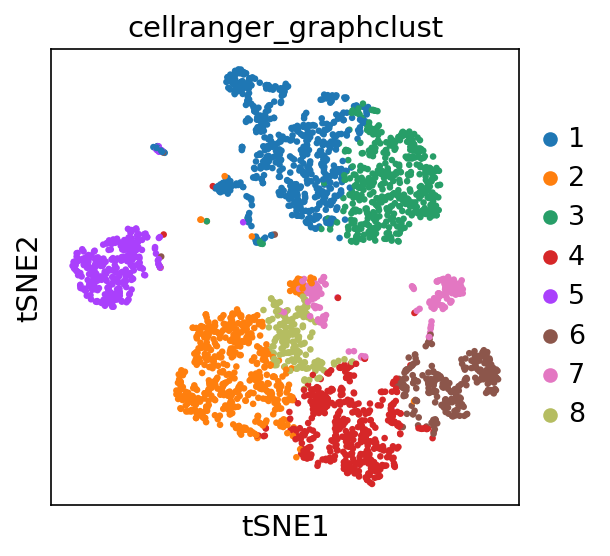
Checkatlas Tsne Report
CheckAtlas
CheckAtlas A one-liner tool for quality control of your single-cell atlases.
Atlas overview
Overview of your single-cell atlases
| Sample Name | AtlasFileType | NbCells | NbGenes | AnnData.raw | AnnData.X | File_extension | File_path |
|---|---|---|---|---|---|---|---|
| pbmc_3k_multiome | Cellranger >= v3 | 3009.0 | 36601.0 | False | True | pbmc_3k_multiome | /data/analysis/data_becavin/checkatlas_test/tuto/data5/pbmc_3k_multiome/outs/pbmc_unsorted_3k_filtered_feature_bc_matrix.h5 |
| pbmc_5k_v3_v3 | Cellranger >= v3 | 5025.0 | 33538.0 | False | True | pbmc_5k_v3_v3 | /data/analysis/data_becavin/checkatlas_test/tuto/data5/pbmc_5k_v3_v3/outs/5k_pbmc_v3_filtered_feature_bc_matrix.h5 |
| pbmc_5k_v3_v7 | Cellranger >= v3 | 5140.0 | 36601.0 | False | True | pbmc_5k_v3_v7 | /data/analysis/data_becavin/checkatlas_test/tuto/data5/pbmc_5k_v3_v7/outs/SC3pv3_GEX_Human_PBMC_filtered_feature_bc_matrix.h5 |
| pbmc_6k_v1_v1 | Cellranger < v3 | 5419.0 | 32738.0 | False | True | pbmc_6k_v1_v1 | /data/analysis/data_becavin/checkatlas_test/tuto/data5/pbmc_6k_v1_v1/outs/filtered_matrices_mex/hg19/matrix.mtx |
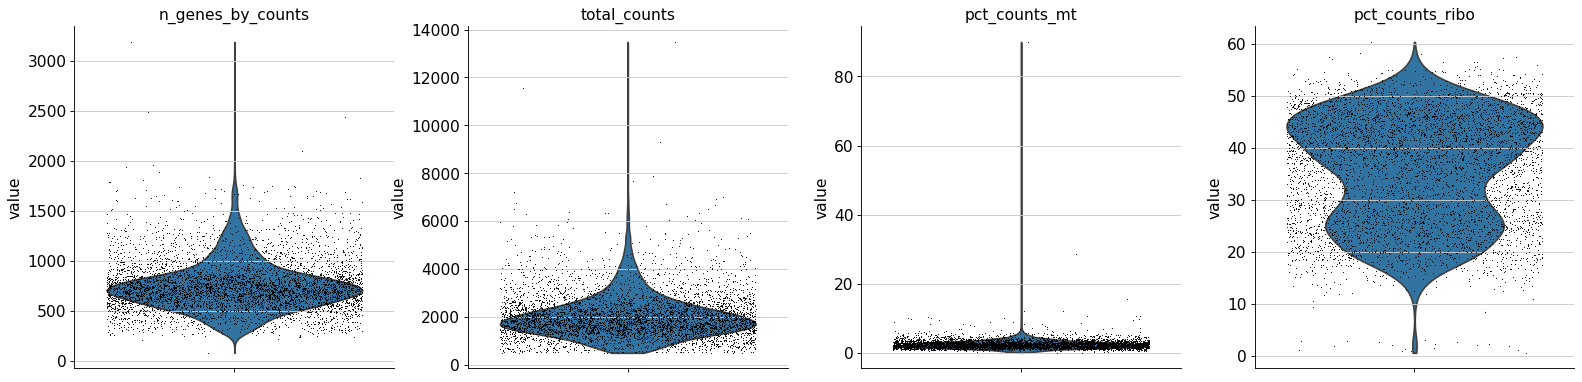
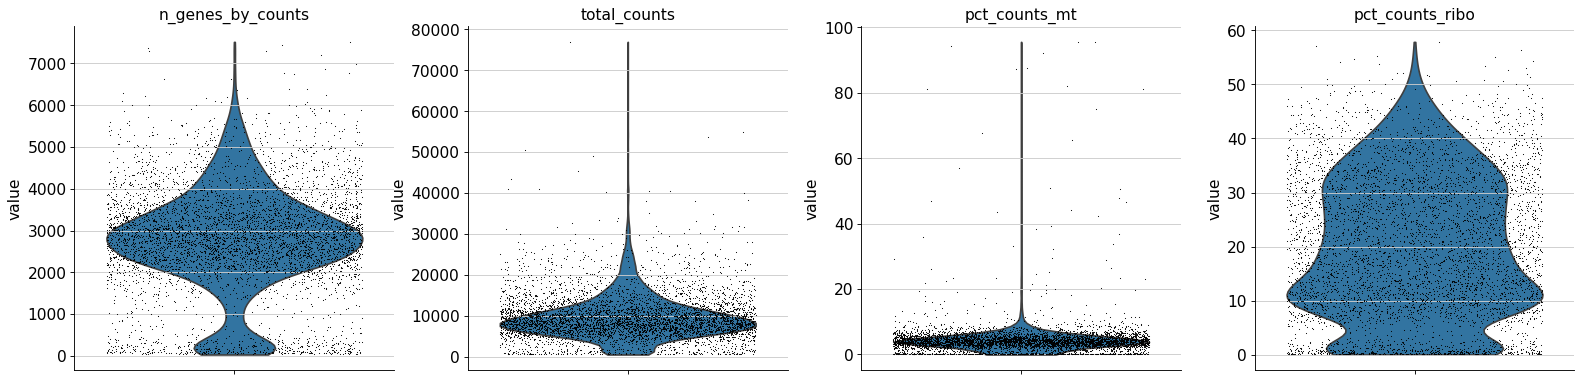
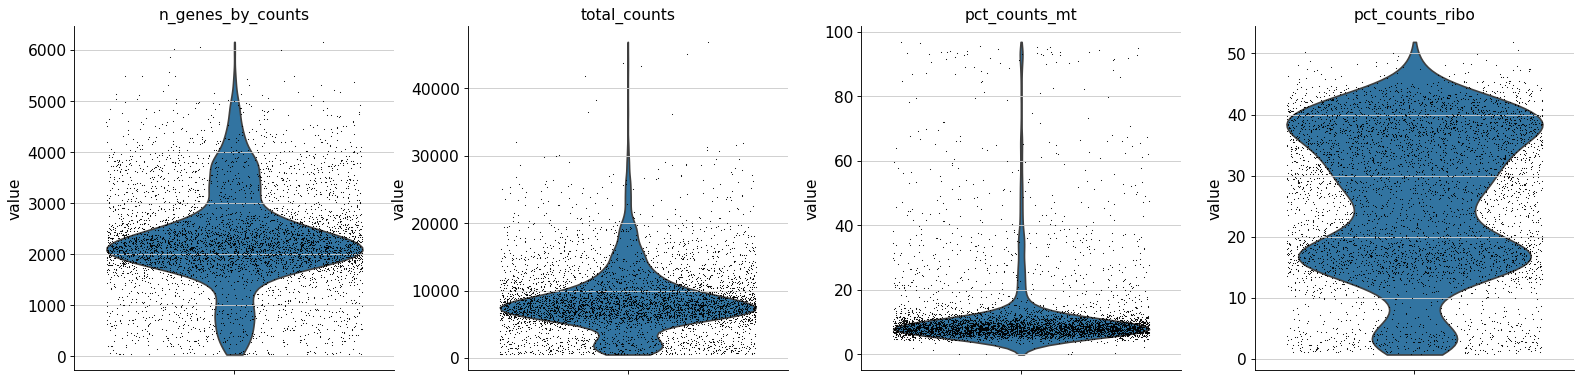
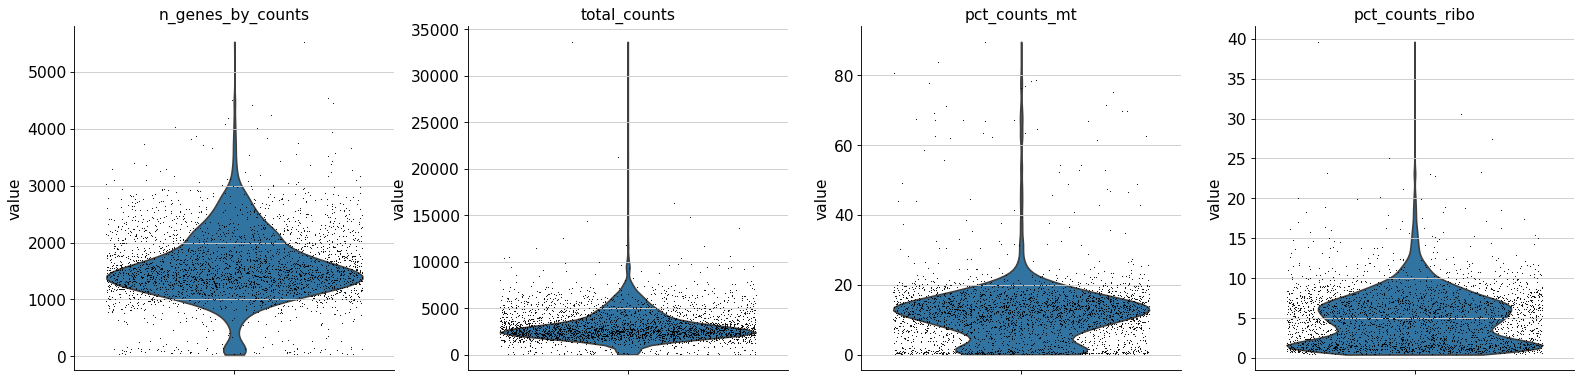
QC total_counts
QC of your atlases log10(Cellrank vs total-counts.
QC n_genes_by_counts
QC of your atlases log10(Cellrank vs n_genes_by_counts.
QC pct_counts_mt
QC of your atlases log10(Cellrank vs pct_counts_mt.
Classification metrics
Quality control metrics calculated on your atlases.
| Sample Name | obs | davies_bouldin |
|---|---|---|
| pbmc_3k_multiome_cellranger_graphclust | cellranger_graphclust | 1.1 |
| pbmc_3k_multiome_cellranger_kmeans_5 | cellranger_kmeans_5 | 0.4 |
| pbmc_5k_v3_v3_cellranger_graphclust | cellranger_graphclust | 0.7 |
| pbmc_5k_v3_v3_cellranger_kmeans_10 | cellranger_kmeans_10 | 0.6 |
| pbmc_5k_v3_v7_cellranger_graphclust | cellranger_graphclust | 1.5 |
| pbmc_5k_v3_v7_cellranger_kmeans_10 | cellranger_kmeans_10 | 1.0 |
| pbmc_6k_v1_v1_cellranger_kmeans_10 | cellranger_kmeans_10 | 1.0 |
Annotation metrics
Quality control metrics calculated on your atlases.
| Sample Name | Reference | obs | rand_index |
|---|---|---|---|
| pbmc_3k_multiome_cellranger_kmeans_5 | cellranger_graphclust | cellranger_kmeans_5 | 0.5 |
| pbmc_5k_v3_v3_cellranger_kmeans_10 | cellranger_graphclust | cellranger_kmeans_10 | 0.9 |
| pbmc_5k_v3_v7_cellranger_kmeans_10 | cellranger_graphclust | cellranger_kmeans_10 | 0.6 |
Dimensionality reduction metrics
Quality control metrics calculated on your atlases.
| Sample Name | obsm |
|---|---|
| pbmc_3k_multiome_X_pca | X_pca |
| pbmc_3k_multiome_X_tsne | X_tsne |
| pbmc_3k_multiome_X_umap | X_umap |
| pbmc_5k_v3_v3_X_pca | X_pca |
| pbmc_5k_v3_v3_X_tsne | X_tsne |
| pbmc_5k_v3_v7_X_pca | X_pca |
| pbmc_5k_v3_v7_X_tsne | X_tsne |
| pbmc_5k_v3_v7_X_umap | X_umap |
| pbmc_6k_v1_v1_X_pca | X_pca |
| pbmc_6k_v1_v1_X_tsne | X_tsne |
Atlas object explorer
Exploration of your Atlas object (Scanpy, Cellanger, Seurat)
| Sample Name | atlas_obs | obsm | var | varm | uns |
|---|---|---|---|---|---|
| pbmc_3k_multiome | cellranger_graphclustcellranger_kmeans_5 | X_umapX_tsneX_pca | gene_idsfeature_typesgenome | | |
| pbmc_5k_v3_v3 | cellranger_graphclustcellranger_kmeans_10 | X_tsneX_pca | gene_idsfeature_typesgenome | | |
| pbmc_5k_v3_v7 | cellranger_graphclustcellranger_kmeans_10 | X_umapX_tsneX_pca | gene_idsfeature_typesgenome | | |
| pbmc_6k_v1_v1 | cellranger_kmeans_10 | X_tsneX_pca | gene_ids | | |
Cell Ranger
Cell Ranger Cell Ranger analyzes single cell expression or VDJ data produced by 10X Genomics.DOI: 10.1038/ncomms14049.
Count - Summary stats
Summary QC metrics from Cell Ranger count
| Sample Name | M Reads | Valid BC | Valid UMI | Estimated Cells | Median UMI/Cell | Median Genes/Cell | Genes Detected | Reads Mapped | Confident Exonic |
|---|---|---|---|---|---|---|---|---|---|
| SC3pv3_GEX_Human_PBMC | 182.3 | 98.2% | 99.9% | 5140 | 8685.0 | 2827.0 | 27572.0 | 95.9% | 53.6% |
Count - BC rank plot
Barcode knee plot
The plot shows the count of filtered UMIs mapped to each barcode. Barcodes are not determined to be cell-associated strictly based on their UMI count. Instead, they could be determined based on their expression profile, or removed via Protein Aggregate Detection and Filtering and/or High Occupancy GEM Filtering. Therefore, some regions of the graph contain both cell-associated and background-associated barcodes. The color of the graph in these regions is based on the local density of barcodes that are cell-associated.
Count - Median genes
Median gene counts per cell
This plot shows the Median Genes per Cell as a function of downsampled sequencing depth in mean reads per cell, up to the observed sequencing depth. The slope of the curve near the endpoint can be interpreted as an upper bound to the benefit to be gained from increasing the sequencing depth beyond this point.
Count - Saturation plot
Sequencing saturation
This plot shows the Sequencing Saturation metric as a function of downsampled sequencing depth (measured in mean reads per cell), up to the observed sequencing depth. Sequencing Saturation is a measure of the observed library complexity, and approaches 1.0 (100%) when all converted mRNA transcripts have been sequenced. The slope of the curve near the endpoint can be interpreted as an upper bound to the benefit to be gained from increasing the sequencing depth beyond this point. The dotted line is drawn at a value reasonably approximating the saturation point.
nf-core/checkatlas Methods Description
Suggested text and references to use when describing pipeline usage within the methods section of a publication.
Methods
Data was processed using nf-core/checkatlas v1.0dev of the nf-core collection of workflows (Ewels et al., 2020), utilising reproducible software environments from the Bioconda (Grüning et al., 2018) and Biocontainers (da Veiga Leprevost et al., 2017) projects.
The pipeline was executed with Nextflow v23.04.1 (Di Tommaso et al., 2017) with the following command:
nextflow run nf-core-checkatlas -r dev --path /data/analysis/data_becavin/checkatlas_test/tuto/data5/References
- Di Tommaso, P., Chatzou, M., Floden, E. W., Barja, P. P., Palumbo, E., & Notredame, C. (2017). Nextflow enables reproducible computational workflows. Nature Biotechnology, 35(4), 316-319. doi: 10.1038/nbt.3820
- Ewels, P. A., Peltzer, A., Fillinger, S., Patel, H., Alneberg, J., Wilm, A., Garcia, M. U., Di Tommaso, P., & Nahnsen, S. (2020). The nf-core framework for community-curated bioinformatics pipelines. Nature Biotechnology, 38(3), 276-278. doi: 10.1038/s41587-020-0439-x
- Grüning, B., Dale, R., Sjödin, A., Chapman, B. A., Rowe, J., Tomkins-Tinch, C. H., Valieris, R., Köster, J., & Bioconda Team. (2018). Bioconda: sustainable and comprehensive software distribution for the life sciences. Nature Methods, 15(7), 475–476. doi: 10.1038/s41592-018-0046-7
- da Veiga Leprevost, F., Grüning, B. A., Alves Aflitos, S., Röst, H. L., Uszkoreit, J., Barsnes, H., Vaudel, M., Moreno, P., Gatto, L., Weber, J., Bai, M., Jimenez, R. C., Sachsenberg, T., Pfeuffer, J., Vera Alvarez, R., Griss, J., Nesvizhskii, A. I., & Perez-Riverol, Y. (2017). BioContainers: an open-source and community-driven framework for software standardization. Bioinformatics (Oxford, England), 33(16), 2580–2582. doi: 10.1093/bioinformatics/btx192
Notes:
- If available, make sure to update the text to include the Zenodo DOI of version of the pipeline used.
- The command above does not include parameters contained in any configs or profiles that may have been used. Ensure the config file is also uploaded with your publication!
- You should also cite all software used within this run. Check the "Software Versions" of this report to get version information.
nf-core/checkatlas Software Versions
are collected at run time from the software output.
| Process Name | Software | Version |
|---|---|---|
| CUSTOM_DUMPSOFTWAREVERSIONS | python | 3.10.12 |
| yaml | 6.0.1 | |
| LIST_CELLRANGER_ATLASES | checkatlas | 0.3.9 |
| LIST_SCANPY_ATLASES | checkatlas | 0.3.9 |
| LIST_SEURAT_ATLASES | checkatlas | 0.3.9 |
| Workflow | Nextflow | 23.04.1 |
| nf-core/checkatlas | 1.0dev |
nf-core/checkatlas Workflow Summary
- this information is collected when the pipeline is started.
Core Nextflow options
- revision
- dev
- runName
- zen_lavoisier
- launchDir
- /data/analysis/data_becavin/checkatlas_test/tuto
- workDir
- /data/analysis/data_becavin/checkatlas_test/tuto/work
- projectDir
- /home/becavin/.nextflow/assets/becavin-lab/nf-core-checkatlas
- userName
- becavin
- profile
- standard
- configFiles
- N/A
Input/output options
- path
- /data/analysis/data_becavin/checkatlas_test/tuto/data5/
- outdir
- N/A
